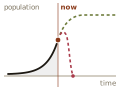
Your place in line
About 117 billion people have been born so far. That makes you roughly person number 117 billion.
Now suppose there are two possible futures. In one, about 200 billion people ever live. In the other, 200 trillion. Call them equally likely to begin with.
Treat yourself as a random pick from everyone who will ever live. If the total is 200 billion, being number 117 billion is ordinary, a bit past the middle. If the total is 200 trillion, you're in the first 0.06% of all humans ever. That's a strange place to be. The bigger future has 1,000 times as many spots in line, so any one spot in it, including yours, was 1,000 times less likely to be the one you got. Your place in line shifts the odds 1,000 to 1 toward the smaller future.
That's the Doomsday argument. It doesn't say the world ends tomorrow. It says a huge future is unlikely, because almost nobody in a huge future would find themselves this early in it.
Meanwhile, in the real world
That's a thought experiment, but the actual numbers are heading the same way, nearly everywhere at once. Women worldwide now average 2.25 children, down from 3.3 in 1990 and almost 5 in the 1950s. More than half of all countries are below the 2.1 it takes to hold a population steady. Europe averages about 1.4 children per woman, North America 1.6, and Latin America and the Caribbean 1.8, down from 5.8 in 1950. Even Africa, with the highest rate, has gone from 6.5 to about 4.
East Asia is the clearest case, but it isn't alone. Nearly a fifth of all countries are below 1.4, from South Korea and China to Italy and Spain. In the 1980s, only 14 countries had passed their peak population, nearly all in Europe and North America. Today it's 63, from East Asia to Latin America, home to more than a quarter of the world's people. The UN expects the world as a whole to top out around 10.3 billion in the 2080s and then shrink.
I'm not going to use this as evidence. The argument above is pure counting and knows nothing about birth rates, and birth rates can turn around. But it's a strange time to be reading an argument that the future is smaller than it looks.
Two ways to be random
"A random pick from everyone who will ever live" hides a choice, and there are two standard ways to make it. Call each possible future a world: one complete history of humanity, first person to last.
Picture each world as a bag of marbles, one per person, numbered in birth order. A small world is a red bag of 10. A big world is a blue bag of 1,000. Your marble says 7.
The self-sampling assumption, SSA, says: flip a coin to pick a bag, then draw from it. A 7 is one marble in 10 from the red bag but one in 1,000 from the blue bag, so drawing a 7 makes red 100 times more likely. That's the Doomsday argument.
The self-indication assumption, SIA, says: pour both bags together and draw once. Blue now supplies 100 times more marbles, so before you look, you're 100 times more likely to be blue. Then you see the 7, and there's exactly one 7 of each color. You're back to 50/50, and under SIA the Doomsday argument says nothing.
Notice what the two rules never disagree about. Once you know which bag your marble came from, its number is just a random draw from that bag. Mixing the bags changes which bag you probably came from, not where you sit inside it. SSA and SIA only fight about which bag you're in.
SIA has its own price. If one theory of the universe has a trillion times more observers than another, SIA says it's already a trillion times more likely, before anyone looks through a telescope. The philosopher Nick Bostrom called this the presumptuous philosopher. People have argued about SSA versus SIA for decades without a winner.
The list nobody can write
So what does the Doomsday argument need, under either rule? It needs a list: every world we might have ended up in, and how likely each one was before anyone checked their place in line. Earlier I gave you two futures at 50/50. I made that up.
Under SIA, your place in line changes nothing, so SIA's forecast is just the list handed back. Under SSA, your place in line tilts the list toward smaller worlds, but never by more than the size gap between them. Either way, the list does most of the work.
Here's a small example. Every possible world has 2 people in its past and 5 in its present, and you're one of the 5. A short-future world has 2 more people after that, 9 in all. A long-future world has 50 more, 57 in all. The long world is about six times bigger, so SSA tilts the odds about six to one toward the short world, and SIA doesn't tilt them at all. That factor of six is the entire disagreement between the rules.
Now suppose the list makes a short future 10,000 times as likely as a long one. Six can't compete with 10,000. Under either rule you're almost certainly in a short-future world. Flip the list, and under either rule you're almost certainly in a long-future world.
How far apart the rules can get depends on how different the worlds' sizes are. Here it's about six. For 200 billion versus 200 trillion it's a thousand. No gap is so big that some list can't outweigh it.
So before anyone can use SIA or SSA to forecast our future, they have to write that list down. I don't see how anyone could justify one. Which kinds of world are possible at all? Is a universe with one long-lived civilization more likely than one with a million short-lived ones? Nobody knows, and the forecast hangs on the answer. The decades-long fight over the rules is a fight over how to read a list that nobody has.
There's a second thing you'd have to pin down: where you are in line. Who counts as a person? Everyone ever born, including babies who died in their first week? Neanderthals? A mind that pops into existence out of random fluctuations with false memories of a past, which physicists call a Boltzmann brain? Each answer gives a different count, and so a different place in line.
So I don't think the argument forecasts anything. But something survives, and it's the part I find interesting.
What's left
Back to the bags. Whatever rule you pick, once you're in a world, you're a typical member of it. Two things follow from that, and neither needs the list.
First, you're probably somewhere crowded. Not just more crowded than average, but crowded in absolute terms. Suppose some stretch of history held ten times as many people as yours. A random person would be ten times more likely to land there than here. You're here. So the odds are against your stretch being dwarfed by any other, and wherever you are is probably one of the busiest parts of the whole timeline.
The figure tries this on different shapes of history. On every one, at least half the people live in eras at least half as busy as the busiest, and fewer than one in ten live in eras less than a tenth as busy.
The exception is a flat population. Then every stretch is as crowded as every other, and "one of the busiest stretches" is true of everyone and says nothing. A long plateau is almost as empty. It also assumes no freak spikes: a boom that lasted a single generation would be the tallest point on the curve while holding almost nobody, and the argument is about where the people are.
Second, a counting fact. Line up everyone a world will ever have, in birth order. The people with more than ten times as many people after them as before them are the first eleventh of the line, about 9% of everyone. More than a hundred times: the first 1%. More than a thousand: the first 0.1%. That's true in every world, whatever its curve looks like.
This is the Doomsday argument's own fact, read as a guarantee instead of a forecast. The forecast, "our future is probably small," needed the list. The guarantee, "in every world, 10 in 11 people have a future smaller than ten times their past," doesn't.
Both facts hold in every possible world. That's why no rule can touch them. SSA and SIA only change how much each world counts, and reweighting worlds that all say the same thing changes nothing.
Where you tend to find yourself
Take away the worlds and what's left is a fact about sampling. Pick one case out of everything that happens, each case equally likely, and it's more likely than a random moment to fall in a busy stretch.
The first time you see a meme is probably near its peak spread, because that's when the most people are seeing it for the first time. If you just caught the flu, it's probably flu season. I'm writing this at 12:51 AM, which is more likely than a random hour to fall in a stretch when I'm writing a lot. And seeing myself as a human at all: I'm one observer out of all the observers like me, so I probably landed in a crowded era of them.
It doesn't tell you what happens next to any one thing. The meme might be about to die, or might have a second wave coming. It doesn't put you at the exact peak either, just near it, in the thick of things.
The falling birth rates from earlier fit that picture. If the world's population tops out this century, the era we live in is the thick of human history. But fitting isn't evidence. The counting fact would say the same thing in a world where births were rising. It doesn't know anything about birth rates. It only knows where you tend to find yourself.